
Page 55 - SAC-Gender-Responsive-Market-Analysis-Final-Report-July-19-2021 (1)
P. 55
3. Markets
St Lucia income opportunity
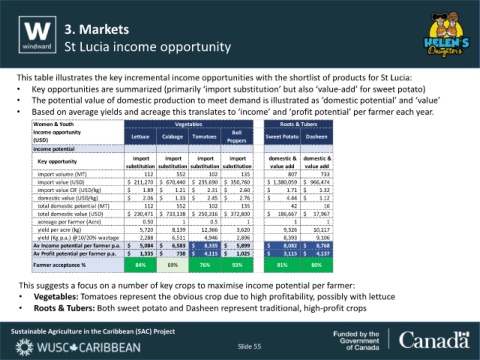
This table illustrates the key incremental income opportunities with the shortlist of products for St Lucia:
• Key opportunities are summarized (primarily ‘import substitution’ but also ‘value-add’ for sweet potato)
• The potential value of domestic production to meet demand is illustrated as ‘domestic potential’ and ‘value’
• Based on average yields and acreage this translates to ‘income’ and ‘profit potential’ per farmer each year.
Women & Youth Vegetables Roots & Tubers
Income opportunity Bell
(USD) Lettuce Cabbage Tomatoes Peppers Sweet Potato Dasheen
income potential
Key opportunity import import import import domestic & domestic &
substitution substitution substitution substitution value add value add
import volume (MT) 112 552 102 135 807 733
import value (USD) $ 211,270 $ 670,440 $ 235,690 $ 350,760 $ 1,380,059 $ 966,474
import value CIF (USD/kg) $ 1.89 $ 1.21 $ 2.31 $ 2.60 $ 1.71 $ 1.32
domestic value (USD/kg) $ 2.06 $ 1.33 $ 2.45 $ 2.76 $ 4.44 $ 1.12
total domestic potential (MT) 112 552 102 135 42 16
total domestic value (USD) $ 230,471 $ 733,138 $ 250,316 $ 372,800 $ 186,667 $ 17,967
acreage per farmer (Acre) 0.50 1 0.5 1 1 1
yield per acre (kg) 5,720 8,139 12,366 3,620 9,326 10,117
yield (Kg p.a.) @10/20% wastage 2,288 6,511 4,946 2,896 8,393 9,106
Av Income potential per farmer p.a. $ 5,084 $ 6,583 $ 8,335 $ 5,899 $ 8,082 $ 8,768
Av Profit potential per farmer p.a. $ 1,335 $ 738 $ 4,115 $ 1,025 $ 3,115 $ 4,137
Farmer acceptance % 84% 69% 76% 93% 81% 80%
This suggests a focus on a number of key crops to maximise income potential per farmer:
• Vegetables: Tomatoes represent the obvious crop due to high profitability, possibly with lettuce
• Roots & Tubers: Both sweet potato and Dasheen represent traditional, high-profit crops
Sustainable Agriculture in the Caribbean (SAC) Project
Slide 55