
Page 97 - SAC-Gender-Responsive-Market-Analysis-Final-Report-July-19-2021 (1)
P. 97
3. Markets
Suriname income opportunity
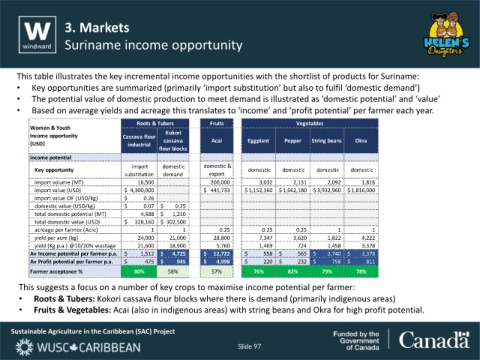
This table illustrates the key incremental income opportunities with the shortlist of products for Suriname:
• Key opportunities are summarized (primarily ‘import substitution’ but also to fulfil ‘domestic demand’)
• The potential value of domestic production to meet demand is illustrated as ‘domestic potential’ and ‘value’
• Based on average yields and acreage this translates to ‘income’ and ‘profit potential’ per farmer each year.
Roots & Tubers Fruits Vegetables
Women & Youth
Income opportunity Cassava flour Kokori
(USD) industrial cassava Acai Eggplant Pepper String beans Okra
flour blocks
income potential
import domestic domestic &
Key opportunity domestic domestic domestic domestic
substitution demand export
import volume (MT) 16,500 200,000 3,032 2,131 2,092 1,816
import value (USD) $ 4,300,000 $ 441,733 $ 1,152,160 $ 1,662,180 $ 3,932,960 $ 1,816,000
import value CIF (USD/kg) $ 0.26
domestic value (USD/kg) $ 0.07 $ 0.25
total domestic potential (MT) 4,688 $ 1,210
total domestic value (USD) $ 328,160 $ 302,500
acreage per farmer (Acre) 1 1 0.25 0.25 0.25 1 1
yield per acre (kg) 24,000 21,000 28,800 7,347 3,620 1,822 4,222
yield (Kg p.a.) @10/20% wastage 21,600 18,900 5,760 1,469 724 1,458 3,378
Av Income potential per farmer p.a. $ 1,512 $ 4,725 $ 12,722 $ 558 $ 565 $ 2,740 $ 3,378
Av Profit potential per farmer p.a. $ 475 $ 945 $ 4,998 $ 220 $ 232 $ 758 $ 811
Farmer acceptance % 80% 58% 57% 76% 82% 79% 78%
This suggests a focus on a number of key crops to maximise income potential per farmer:
• Roots & Tubers: Kokori cassava flour blocks where there is demand (primarily indigenous areas)
• Fruits & Vegetables: Acai (also in indigenous areas) with string beans and Okra for high profit potential.
Sustainable Agriculture in the Caribbean (SAC) Project
Slide 97